-
A stock investment game between monkeys and fund managers ended with the monkey's victory. In Korea, there was a stock investment game between parrots and indi...
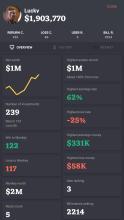
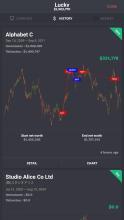
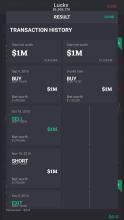
Chart Game Person vs Monkey
A stock investment game between monkeys and fund managers ended with the monkey's victory. In Korea, there was a stock investment game between parrots and individual investors. it also ended with a parrot's victory. Since these two games were conducted within less than 10 months, it is hard to say that 'monkeys are better than humans'. Now let's start the game in a new way. Monkeys and you are playing an investment game with same stocks. When the game starts, a chart of stocks appear randomly. Monkeys have already bought stocks one year ago at the time when the game begins, and you can buy and sell stocks by analyzing charts over a period of one year. In other words, a monkey is a long-term investor who buys and holds stocks over a two-year period, and you are a short-term investor who can do short-term trading by analyzing your charts. When the period of a year ends, you can compare your return with the monkeys', and you can extend the duration for investment if necessary. (Item required.) When the investment is over, you can check which company you invested with the monkey, the period of time, and the company's information. Win the competition with monkeys and increase your wealth to become the world's richest person. ► The data provided in the game is actual historical stock data for the US, South Korea, and Japan. ► The exchange rate in the game is $1 = ¥100 = ₩1000. ◆◆◆ You can analyze charts with various kinds of charts and indicators. ◆◆◆ Candlestick chart - A candlestick chart (also called Japanese candlestick chart) is a style of financial chart used to describe price movements of a security, derivative, or currency. OHLC chart - An open-high-low-close chart (also OHLC) is a type of chart typically used to illustrate movements in the price of a financial instrument over time. Area chart - An area chart or area graph displays graphically quantitative data. It is based on the line chart. The area between axis and line are commonly emphasized with colors, textures and hatchings. Commonly one compares two or more quantities with an area chart. Renko chart - A renko chart is a type of financial chart of Japanese origin used in technical analysis that measures and plots price changes. Kagi chart - The Kagi chart is a chart used for tracking price movements and to make decisions on purchasing stock. Line chart - A line chart a type of chart which displays information as a series of data points called 'markers' connected by straight line segments. Moving average - In statistics, a moving average is a calculation to analyze data points by creating a series of averages of different subsets of the full data set. Bollinger Bands - Bollinger Bands are a type of statistical chart characterizing the prices and volatility over time of a financial instrument or commodity, using a formulaicmethod propounded by John Bollinger in the 1980s. Parabolic SAR - In stock and securities market technical analysis, parabolic SAR (parabolic stop and reverse) is a method devised by J. Welles Wilder, Jr., to find potential reversals in the market price direction of traded goods such as securities or currency exchanges such as forex. Volume chart - The Volume Chart shows the number of shares that have been traded over a given period. MACD - MACD is a momentum and trend-following indicator that uses three different moving averages. Force Index - The force index (FI) is an indicator used in technical analysis to illustrate how strong the actual buying or selling pressure is. RSI(Relative Strength Index) - It is intended to chart the current and historical strength or weakness of a stock or market based on the closing prices of a recent trading period. ATR - ATR is a volatility indicator. A high (or low) ATR indicates that a stock is more (or less) volatile. Stochastic oscillator - In technical analysis of securities trading, the stochastic oscillator is a momentum indicator that uses support and resistance levels.
Chart Game Person vs Monkey游戏截图

新游排行榜


新游期待榜
热门推荐


相关专题
最新专题
- 异环手游安卓怎么下载攻略
- 远征传说下载方式介绍
- 曙光重临下载方式介绍
- 曙光重临最新版下载地址
- 远光84中文版下载地址分享
- 龙石战争内测版下载地址链接
- 异环体验服下载地址在哪里
- 远征传说预约地址在哪
- 经典的手游生存游戏下载推荐
- 耐玩的音乐小游戏有哪些
- 关于火的手游下载推荐
- 热门的喜羊羊游戏闯关游戏推荐
- 人气较高的修仙单机手游推荐
- 好玩的换装手游排行榜
- 好玩的3d格斗手机游戏排行榜
- 运动会可以玩的游戏有哪些2023
- 一个勇士救公主的老游戏叫什么
- 以前有一款滚球叫什么游戏
- 真正的山海经吞噬进化游戏推荐
- 游戏热度排行榜前五
- 人气较高的单机网游分享2023
- 网易最好玩的仙侠手游推荐
- 人气较高的游戏车比赛下载合集
- 好玩的五子棋游戏下载双人推荐
- 好玩的3d动作网络游戏下载合集
- 关于计算机的游戏排行榜
- 网易游戏很火的游戏有哪些
- 开心消消乐游戏大全分享2023
- 类似中世纪吃鸡游戏有哪些2023
- 中巴车模拟驾驶游戏2023
- 友情链接
- 最新游戏

 粤公网安备44010602000283号

玩家评论
更多>>全部评论